User's guide
The SI2PEM main page shows an interactive map with exact locations of electromagnetic field measurements. The map also presents all the base transceiver stations in Poland. Each point on the map represents one measurement plumb and its corresponding measurement results. Since some uncertainty of measurement is taken into account, the actual level of intensity is insignificantly lower than presented.
The map can be viewed on any device with Internet connection. Measurement results and electromagnetic field simulations are of public access. For your best experience, the website should be viewed on large-screen devices such as computers and tablets.
To contact the SI2PEM team, click here or use the Contact us button at the bottom of the page.

Top bar
At the top of the page you will find the main navigation bar. It lists the contents of the page:
- The SI2PEM logo — reloads the home page.
- About EMF — contains all the necessary information about electromagnetic field (EMF) and the nature of its impact on humans and the environment.
- SI2PEM in numbers — contains reports, statistics and other data related to EMF measurements. The data may be displayed with division to chosen voivodeships and includes data from environmental monitoring. The reports are available for download.
- Submitted installations — contains a list of applications for new base transceiver stations.
- User's guide — you are here — contains user guides for the SI2PEM map and the whole platform.
- Read more (PL) — redirects to the gov.pl portal, which presents additional information about SI2PEM.
- SI2PEM Expert (PL) — redirects to the login page available for accredited laboratories, authorized offices, and mobile operators.
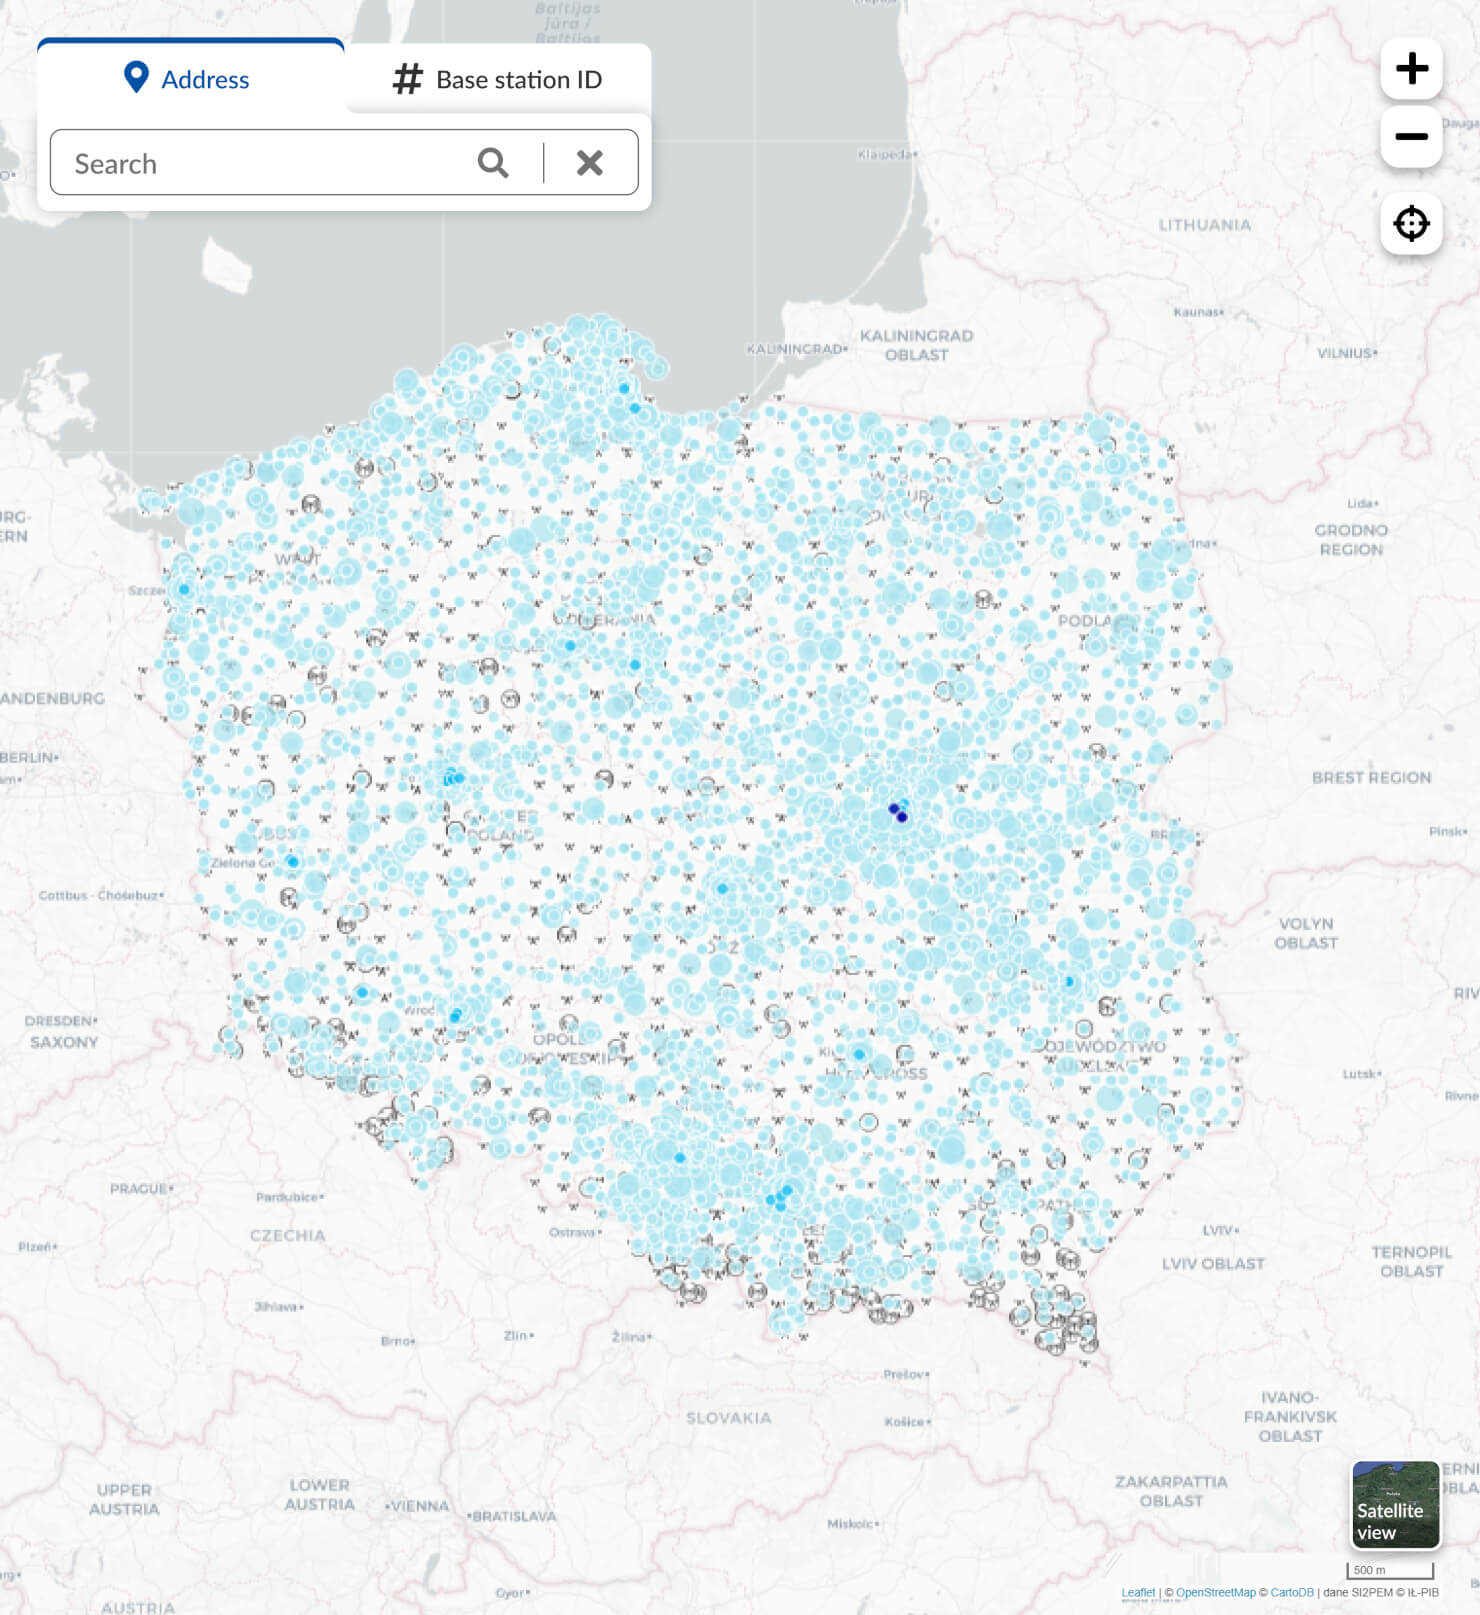
Map
The map presents electromagnetic field (EMF) measurements taken in Poland and the locations of base transceiver stations and DVB-T antennas.
- Colored dots — represent EMF measurement points. Once clicked, a tooltip with detailed information will show.
- Search bar — search for any location by its address or a base station by its ID. By default, the search engine will look for an address. To find a base station by its identifier, click on the "BTS identifier" tab available at the top of the search bar. To carry out a search, type in an address (e.g. "Szachowa 1, Warszawa") or the station's ID. Note: please use Polish city names. Press enter or click on the magnifying glass icon and a list of matched addresses or base stations will appear. Select one and once clicked, the map view will take you to the chosen location.
- The +⁄− buttons — zoom the map in and out. This can also be done by pressing Ctrl and scrolling, as well as by single or double clicks on the map view. Pinch the map to zoom if you are using a mobile device.
- Geolocation button — once clicked, the view will zoom in to your current location provided it is enabled on your device and/or browser settings.
- Satellite / Map button — located in the bottom right corner of the screen. Click to change between satellite view and simplified grayscale view.
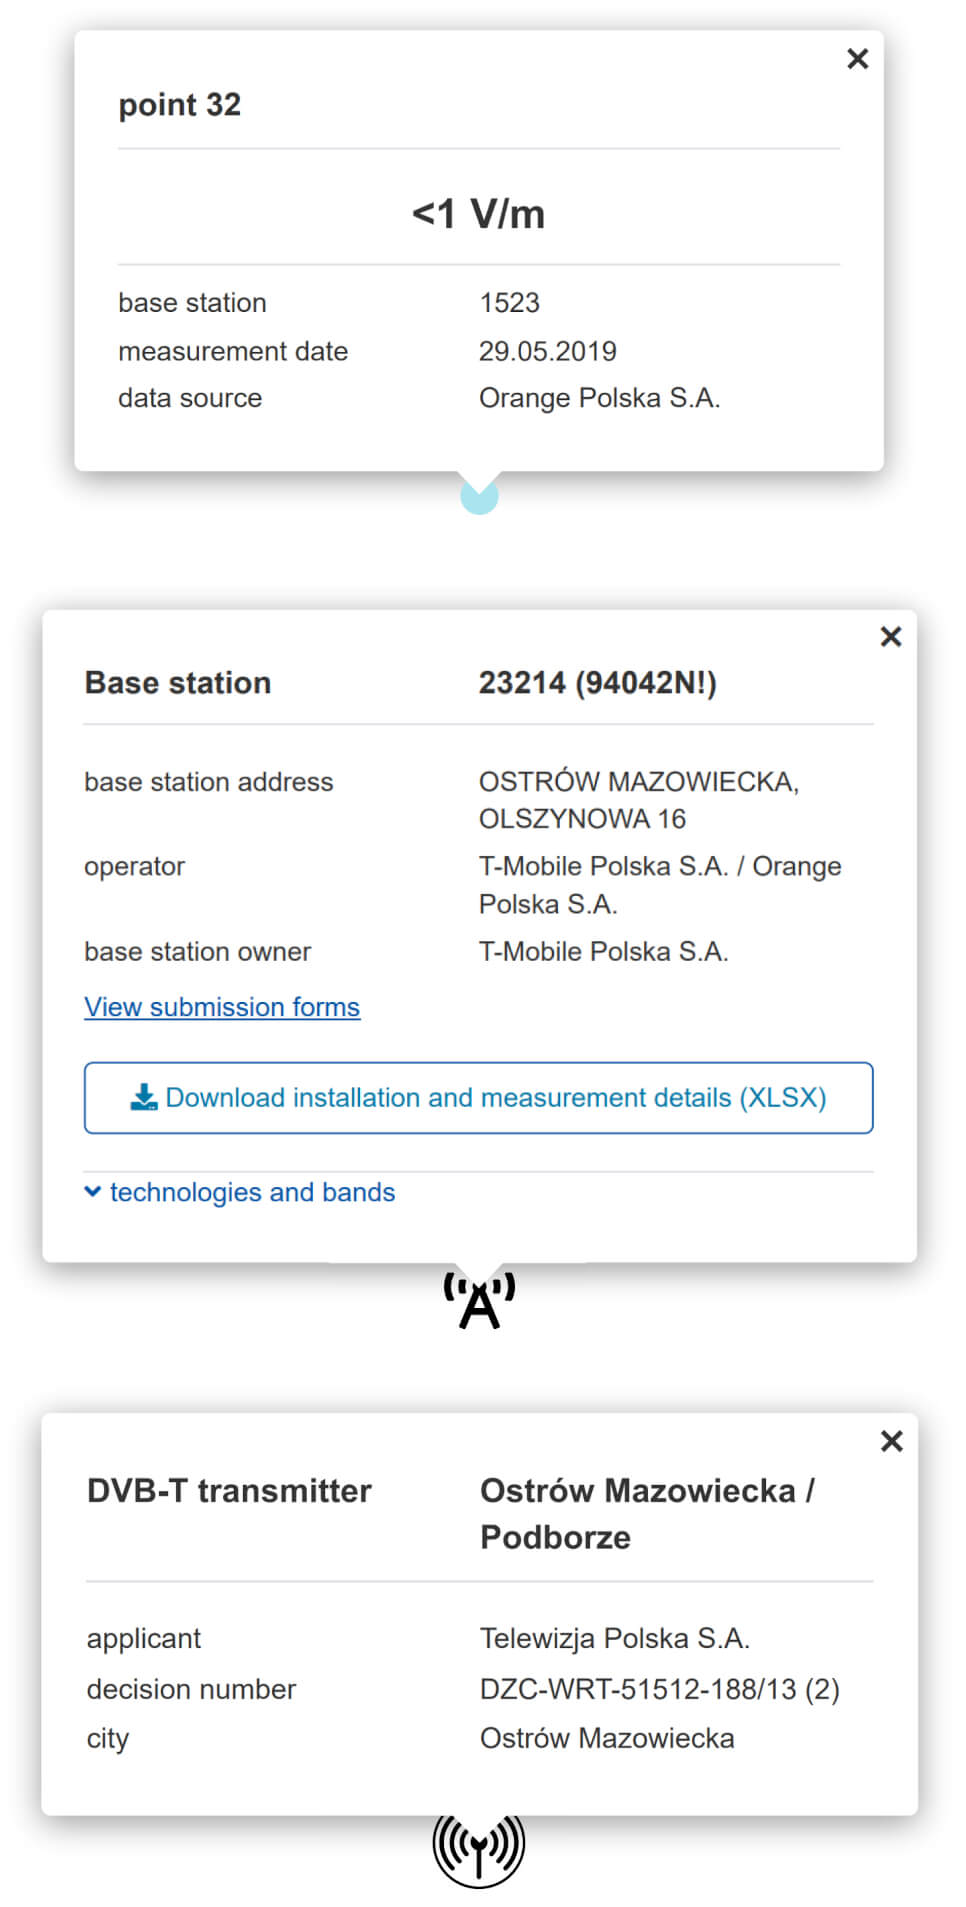
Measurement points, base transceiver stations, and DVB-T transmitters
Measurement points are presented as dots with colors corresponding to the levels electromagnetic field (EMF). The ranges of EMF values and their corresponding colors are presented on the left sidebar. Once clicked, a box with detailed information will open. The value is measured in V/m and takes into account the measurement uncertainty, so the actual level of EMF is insignificantly lower than presented. Often the EMF level is below the meter sensitivity threshold. In such a case, the measurement result is preceded by a minority sign. For example, if the meter sensitivity threshold is 1 V/m and the EMF level at the measured location is below the threshold, the result is presented as <1 V/m. The percentage of the limit value is shown below the measured value, where the limit (100%) is the maximum EMF level permissible in Poland. For broadband measurements, it is set at 28 V/m according to the Regulation of the Minister of Health. The box also shows information about the base station corresponding to the given EMF measurement.
The map depicts base stations as black telecommunication mast icons.
Click on the mast icon to open a detailed information box that includes: the station's ID, full address and the operator names.
If the station is used by more than one operator, the name of the station's owner is also displayed.
Click on "View submitted installations" to go to a page containing operator submission forms.
"Technologies and bands" provide information on radio licences and licence-free devices, extracted from the Office of
Electronic Communications (UKE) register. Detailed information on measurements for a selected base station can be downloaded as an XLSX file.
DVB-T transmitters are presented as circled black antenna icons. Click on the DVB-T transmitter icon to see detailed information about the selected transmitter.
There is a radio installation in my vicinity, but I cannot see it on the SI2PEM map. What should I do?
The SI2PEM system provides information on base transceiver stations (BTS) and terrestrial TV transmitters (DVB-T) as sources emitting the majority of electromagnetic field. The sources of such data is the official register of radio installations and licence free devices. The register is publicly available at the Office of Electronic Communications (UKE) and at the Public Information Bulletin of UKE (BIP UKE) website. Another source of data are the telecommunication operators. All the gathered data is successively supplemented and verified in accordance with the installation process and adjustment notifications. SI2PEM does not provide information about installations emitting an electromagnetic field several dozen to several thousand times lower than BTS or DVB-T stations. These include i.a. low-power licence-free radio devices. The same applies to military installations as well as public and state security services. If SI2PEM does not provide information about a radio installation in your vicinity, please inquire at the local UKE office for help. Thanks to the Telecommunications Law "Art. 199 sec. 2. The President of UKE is entitled to inspect equipment that is on the market or has been put into service. That includes telecommunications terminals and radio equipment”.
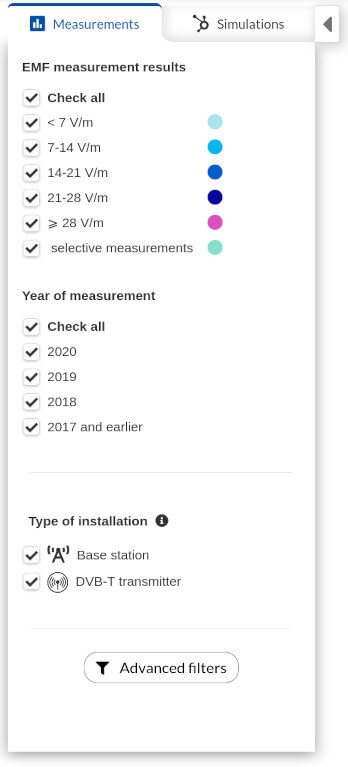
Sidebar - measurements
The sidebar provides a map key and enables filtering.- EMF measurement results — only the values of selected ranges are displayed on the map. The maximum permissible EMF value for broadband measurements in Poland is 28 V/m.
- Year of measurement — filter measurements by year.
- Base station — show or hide base transceiver stations on the map.
- DVB-T transmitter — TV broadcast transmitter. Enable or disable all DVB-T transmitters on the map.
- Advanced filters — opens a box with more advanced options for filtering the data displayed on the map: filter by network operator or by measurement data source. Selecting archival data enables deactivated (historical) base stations and measurements taken in their vicinity.
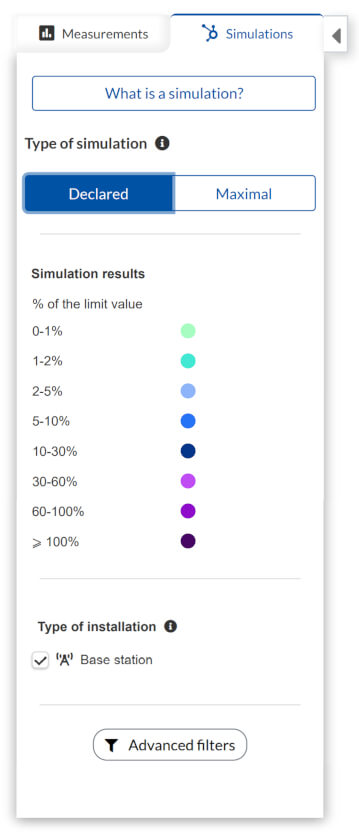
Sidebar - simulations
Click on the Simulations tab to select one of the available simulation types. The simulations do not include data from base stations with incorrect or incomplete parameters. Currently the simulations include data from approximately 84.0% of existing base stations.- Declared EMF simulation — assumes that base stations operate at their typical commercial traffic with the average power declared by the owner.
- Maximum EMF simulation — assumes all base stations operate with their maximum traffic and maximum power specified in the application. Such a situation may theoretically occur, although only for short periods of time and with a very low probability.
- Simulation results — shows the percentage ranges of the EMF limit value and how they are displayed on the map.
- Base station — base transceiver stations for mobile networks. When checked, all base stations operated by mobile providers are displayed.
- Advanced filters — opens a box with more advanced options for filtering the data displayed on the map: filter by network operator or by measurement data source.
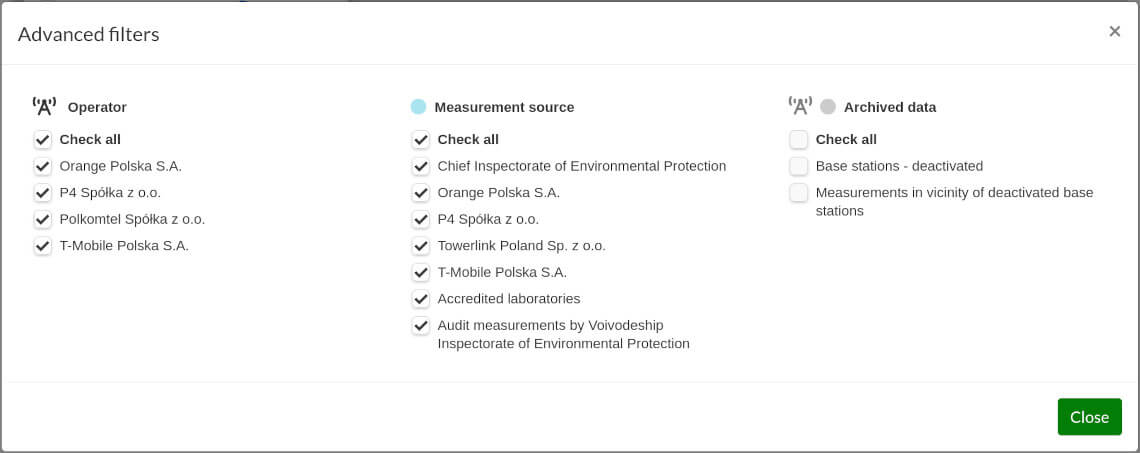
Advanced filters
Click on the Advanced filters button to open a box with more advanced options for filtering the data displayed on the map.- Operator — filter base stations by operator.
- Measurement source — filter by measurement data source.
- Archived data — enables deactivated (historical) base stations and measurements taken in their vicinity during the time of their activity.